Data Literacy and Statistics
Not being fooled by numbers, including your own.
During World War II the military studied returning bombers and marked where the bullet holes were. The plan was to armor those spots. A statistician named Abraham Wald said no: armor where there are no holes. The planes hit there never came back. The data you have is not the data that matters.
What is a number you believe but have never checked?
The average person does not exist.
Watch it in four minutes.
What it is, in plain words.
- 10 lessons
- 10 modules, each with a test
- 2 people explained
- 61 works, places and ideas explained
- 12 question final exam
Statistics is the science of learning from data in the presence of uncertainty. Data literacy is the everyday version: the ability to read a number, a chart or a study and know how far to trust it.
Two jobs make up most of the field. Description summarizes what was measured, with averages, spreads and graphs. Inference reaches from a sample to the wider population, and always carries a margin of error. The classic traps are few. Averages hide variation. Samples can be unrepresentative. Correlation is mistaken for cause. Small effects are dressed up as large ones, and charts can mislead by their scales. A numerate reader asks three things of any figure: how was it measured, compared with what, and how sure are we.
Five ideas to hold
The mean is the arithmetic average. The median is the middle value and is less distorted by extremes.
The mean is what most people call the average: add the values and divide by how many there are. The median is the middle value when they are lined up in order. They differ when the data are lopsided. If nine people earn 30,000 and one earns 3 million, the mean income is over 300,000, which describes nobody. The median stays at 30,000. That is why income and house prices are usually reported as medians.
A subset chosen to represent a larger population. Its quality limits everything concluded from it.
You cannot ask everyone, so you ask a sample. What matters most is not its size but how it was chosen. A random sample of a thousand can describe a country well. A self-selected sample of a million can be badly wrong. In 1936 a magazine polled over two million people about the American election and got it wrong, because its lists favored the wealthy. George Gallup, with a far smaller and better-chosen sample, got it right.
A measure of how spread out the values in a data set are around the mean.
Standard deviation says how far values typically sit from the mean. Two classes can both average 70 percent on a test. In one, everyone scored close to 70. In the other, scores ran from 30 to 100. The second has a much larger standard deviation. For data that follow the bell-shaped normal curve, about 68 percent of values fall within one standard deviation of the mean and about 95 percent within two.
A result unlikely to be due to chance alone. It says nothing about whether the effect is large.
A result is called statistically significant when it would be unlikely to arise by chance if there were no real effect. The usual threshold is a probability below 5 percent, written p less than 0.05. The term is widely misread. It does not mean that the effect is large or important. With a big enough sample a trivial difference becomes significant. It also does not mean there is a 95 percent chance the finding is true.
The range within which the true value probably lies, given the size of the sample.
A poll that reports 52 percent with a margin of error of 3 points is saying that the true figure is probably between 49 and 55. The margin shrinks as the sample grows, but slowly. To halve it you need four times as many people. It covers only the luck of the draw. Biased wording and people who refuse to answer are not included. When two candidates are within the margin, the honest headline is that the race is too close to call.
Five moments that made the field
- 1662John Graunt studies London's death records and founds the study of population data.
- 1763The theorem of Thomas Bayes is published after his death.
- 1858Florence Nightingale uses charts to show what was really killing soldiers.
- 1925Ronald Fisher publishes Statistical Methods for Research Workers.
- 1936A magazine poll of millions misjudges the US election while Gallup's small sample gets it right.
Still argued about
Should probability measure how often things happen or how strongly we believe?
Does the usual threshold for significance do more harm than good?
How far should decisions about people be left to predictive models?


Three facts, one myth, one dare.
Numbers do not lie.
Tap to turn it overNumbers are chosen, framed and scaled by people. Always ask "compared with what?"
Find a chart in today's news and check whether its axis starts at zero.
10 sections, 10 lessons.
- 1
The briefing
Mean and median · Sample · Standard deviation · Statistical significance
- 2
Introduction to Data Literacy
Defining Data Literacy · Types of Data · Sources of Data
- 3
Basic Concepts in Statistics
Descriptive Statistics · Probability Fundamentals · Distributions
- 4
Collecting and Organizing Data
Data Collection Methods · Sampling Techniques · Data Organization
- 5
Analyzing Data
Inferential Statistics · Correlation and Causation · Regression Analysis
- 6
Data Visualization
Principles of Effective Visualization · Clarity · Simplicity · Accuracy
- 7
Critical Thinking with Data
Evaluating Statistical Claims · Understand the Study Design · Examine the Data · Assess Statistical Significance
- 8
Statistical Software and Tools
Introduction to Statistical Software · Basic Data Manipulation and Analysis Techniques · Descriptive Statistics · Data Visualization
- 9
Applications of Data Literacy
Data Literacy in the Workplace
- 10
Conclusion
The Power of Data-Informed Decision Making · Continuing the Data Literacy Journey
Two jobs make up most of the field. Description summarizes what was measured, with averages, spreads and graphs. Inference reaches from a sample to the wider population, and always carries a margin of error. The classic traps are few. Averages hide variation. Samples can be unrepresentative. Correlation is mistaken for cause. Small effects are dressed up as large ones, and charts can mislead by their scales. A numerate reader asks three things of any figure: how was it measured, compared with what, and how sure are we.
People to know.
Persuaded with charts
Survivorship bias
Updating belief with evidence
Exploratory data analysis
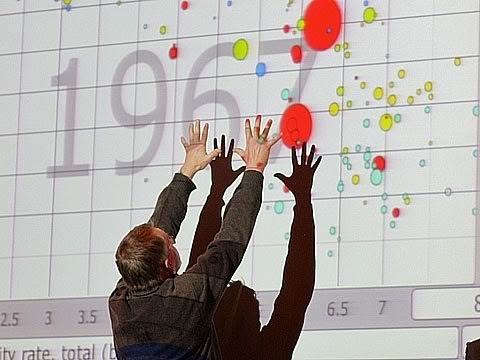
Made world data move
Books to read.
- How to Lie with StatisticsDarrell Huff
- The Signal and the NoiseNate Silver
- FactfulnessHans Rosling
A question from its final exam.
The median is
2 people, each one explained.
Twelve of them are below. In the Atlas every name, work and place in the text opens a short account of who or what it is.
 Hadley Wickham born 1979
New Zealand statistician Wes McKinney born 1985
Statistician, data scientist


Descriptions and dates from Wikidata. Portraits from Wikimedia Commons, each linked to its author and license.
What a full picture of the field includes.
Every chapter was checked against a list of the names and terms a student of the subject should meet. These are the most important ones the book itself does not name.

Statistician whose books on the display of information taught designers to show the data and remove decoration.
The Scottish engineer who invented the line graph, the bar chart and the pie chart around 1800.

Victorian scientist who discovered correlation and regression to the mean. He also founded eugenics.

A founder of modern statistics, who gave us the correlation coefficient and the chi-squared test.
Ignoring how common something is when judging a particular case. It is why a positive test for a rare disease is often wrong.
Extreme results tend to be followed by more ordinary ones. It is often mistaken for the effect of a treatment.
As a sample grows, its average settles toward the true average.
Averages of many independent samples form a bell curve, whatever the shape of the original data.
A trend seen in every group can reverse when the groups are combined.
When a measure becomes a target, it stops being a good measure.

Swedish doctor whose animated charts showed how far world health and income have improved, and how wrong our guesses about them are.
More of the field
6 more people and ideas a student of this subject should meet. In the Atlas each one opens a card with facts, dates and a portrait.
Bradley EfronDaniel KahnemanGregory BenfordJerzy NeymanBlack swanMonte Carlo
Read Data Literacy and Statistics.
Free. The film, the briefing and the first section open without an account.